Showing posts with label Patterns. Show all posts

Friday, February 22, 2019

Haidilao Int holding 6862.HK : Cup and Handle Pattern

Haidilao International holding 6862.HK , one of the popular hotpot restaurants in China and of coz Singapore as well.

Based on chart, Cup and Handle Pattern has been forming.


Business Summary:
Haidilao is one of the leading global and fast-growing Chinese cuisine restaurant brands focusing on hot pot cuisine. Haidilao serves more than 100 million guests a year, with its global restaurant network growing from 112 in 2015 to 273 in 2017. There are more than 300 Haidilao restaurants around the world, with 296 in the People’s Republic of China, 24 in Taiwan and Hong Kong, with the rest in Singapore, Japan, South Korea and USA. It is worth mentioning that there are a total of 8 Haidilao restaurants in Singapore – nearly a third of Haidilao restaurants located outside of China, Taiwan and Hong Kong.

On Mon, Sep 24, 2018 at 12:41 PM, wrote:

Phillip Securities is the first broking house in Singapore and Hong Kong to offer customers the Pre-IPO trading channel. The Hong Kong Pre-IPO trading market is a channel provided by Phillip Securities for customers to trade Hong Kong shares one day before their official listing in the Hong Kong Exchange. 

Today is Haidilao International Holding LTD (6862.hk) Pre-IPO trading day from 4.15pm-6.30pm. Haidilao ’s IPO is priced near the top range at HK$ 17.8, raising approximately HK$7.56 billion (US$963 million). Actual listing on HK exchange is on Wednesday as Tuesday is HK public holiday. 

Haidilao International Holding Ltd is a China-based company principally engaged in the restaurant operation business. The Company is mainly engaged in the operation of hotpot chain restaurants under the brand of Haidilao. The Company is also involved in the takeaway business, as well as the sales of condiments and ingredients. The Company operates its businesses mainly in the domestic market. 


Hong Kong Pre-IPO
Hong Kong Pre-IPO: Haidilao International Holding LTD (6862.hk)
Trading day for HK Pre-IPO market: 24 Sep 2018 Today (Monday)  
Trading hours for HK Pre-IPO market: 4.15pm-6.30
Actual IPO listing: Wednesday as Tuesday is HK public holiday


How to buy China A Share Bank Stocks online?


Netflix shot up almost 15% within 2 days


Hi-P (H17) : Cup and Handle Pattern

Hi-P (H17) is a Singapore stock that recently has forming a Cup and Handle Pattern.


Business Summary

Hi-P International Limited is an integrated contract manufacturer. The Company is engaged in the design and fabrication of mold (MDF), precision plastic injection molding (PPIM), assembly and provision of ancillary services (surface finishing services). Its segments include Precision plastic injection molding; Mold design and fabrication, Assembly, which is engaged in the provision of sub-product assembly and full-product assembly services. It provides solutions to customers in industries, such as telecommunications, consumer electronics, computing and peripherals, lifestyle, medical and industrial devices from design, electro-mechanical parts, modules to product manufacturing services. It has approximately 10 manufacturing plants located in over six locations in the People's Republic of China (Shanghai, Chengdu, Tianjin, Xiamen, Suzhou and Nantong), Poland, Singapore and Thailand. It has marketing and engineering support centers in China, Singapore, Taiwan and the United States


Trading Stock using Cup and Handle Pattern with High Probability

Thursday, June 2, 2016

Trading Stock using Cup and Handle Pattern with High Probability

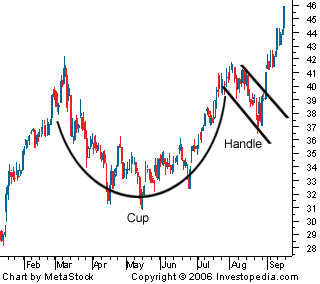
Cup and Handle


What is a 'Cup and Handle'

A pattern on candlestick chart resembling a cup with a handle. The cup is in the shape of a "U" and the handle has a slight downward drift. The right-hand side of the pattern has low trading volume - Investopedia

Did you notice that the recent 25% rally of Thaibev can be clearly identified by this pattern?

What about SIA engg, does this look like a similar pattern? I notice that SIA engg also have his first golden cross after falling for 2 years, is it time for this counter to recover?


Join us on our upcoming WorkShop. "7-step Stock Picking Formula" - Inspired by the great trader William O Niel.  
 
Click here to Register - $9.50 pay at the door

Thursday, July 10, 2014

Indonesia Election 2014- will the Stock market Be more Bullish after Election

Indonesia Election 2014- will the Stock market Be more Bullish after Election

One of my Friend ask How can she buy Indonesia stock. By buying an individual stock in a foreign country is difficult because we have very little understand how good is the company. One of a way is to buy an Index, if you just want to invest in the overall market sentiment.

The stock chart above is listed in NYSE - stock code IDX, Market Vectors Indonesia Index.
https://www.vaneck.com/library/market-vectors-etfs/idx-fact-sheet-pdf

From the chart pattern, we saw a breakout from a Cup and Handle pattern, this also tell us that investors are Buying up, Banker's money is (just) increasing.
/
Thinking back, India and Malaysia market have a big rally after the Election. Is it time for Indonesia?

Pls like our fanpage for latest Update  https://www.facebook.com/ARTeamTradersClub

Friday, October 4, 2013

COSCO - Chart Pattern is forming


Once upon a time the popular stock called COSCO, during the peak it was almost $8 but today we are not going to talk about history. Recently, chart pattern is forming with volume decline. So, question is will it break above or below ? 


If we apply our ART Position system, it look more like up side for (mid term) trade. Possible strategy can be apply are short term breakout trade and mid term trade. With current market situation, we believe most people will want to play short term breakout trade, either way if break above we go for long and if break below then we go for short. So, Plan your trade and let the market tell us what to do and see how it performs when market open! 

Wednesday, October 2, 2013

SGX - Short Sell ?


SGX is weak after hitting resistant from 7.60, current price 7.20 is at critical support level and if broken we believe it will go down side. Short Seller will be watching this stock closely and once broken below 7.20, Short Seller may start to short and 1st target price to cover back may be at 6.95 and 2nd target at 6.75. Only use CFD for Short Sell.

Wednesday, December 15, 2010

Uob-KH Cup and Handle Pattern

Uob-KH closed 1.73 today, this stock is forming a cup and handle pattern. 1) cup is formed 6month old, 2)handle is 1/3 depth of cup. 3) the shape looks like a cup and handle.

It need to break above the resistance 1.81 with volume to consider complete. If break above resistance the profit target will be roughly same as distance between bottom of the cup to right peak of the cup( in short, target ard $2.20). Tomorrow can consider early entry.

Setup for tomorrow: Entry: 1.75, Stoploss 1.62, Timeframe: mid-long term(2week-3month). This stock has very low volume,you might not be able to get big lot size. The trick to buy slowly, and buy in odd numbers 3,5,11,13. Do the abnormal way and you will not alert the Big Boys.

This pattern is not develop by me, i also read from other websites and book. For more info, please do a google search on "cup and handle". Tomorrow going to phuket for holiday, this will be my last post for this week. Cheers~

Thursday, November 25, 2010

Osim, Market outlook 2

Hisaka had a ascending triangle breakout, if you can see the time and sales, the breakout actually happened near closing, hence signify that traders are bullish about the next day's opening. A ascending triangle breakout is a continuous pattern, meaning the uptrend will continue. This is a 40cents stocks,high volatility, if you are investing, please do your money management. know how much you will lose if hit your stop loss. Suggested stoploss will be 0.39. Entry 4.15, mid-long term trade.

Osim, one of my favourite, it is now 1.46 already, i did a search for my first post on this stocks in september, and that time was only 1.05. If you have followed and traded using cfd(leverage), you should have made more than 50% of you capital.
Tml can enter again, the 6times to add position, due to the current market outlook, i suggest we add minimum position into this stock. Next resistance 1.67

Market outlook: Again be patience, market is now behaving like the correction in august, need more time to recover. Once it is back, we will have plenty of opportunity to buy again.

So how to have many good stocks like Osim? Example: Alot of times, people start investing by buying 3-5 stocks(lets say 5 la), after sometimes, market corrects and we will see 4 out of 5 stocks lose money. So what will a normal person do? A normal person will sell the 1 stocks that has made money(put profit money in pocket is safer ma), and keep the 4 stocks that is having small losses.(they call it holding power, so no worries). After sometimes, opportunity comes and they don't have money to buy again because they are still holding on to the losers. Ironically,the right way to do is the opposite, what a good trader do is to sell off the loser first, and keep the winner, and add position to the stocks that has always been making money. If you keep doing this way, eventually you will have a portfolio of all the good stocks, which u can call them your good employees.

With regards to my previous post which i have posted a long list of stocks that have underperformed. Those are the bad employees that will make you lose money, if your stocks is not inside the list means they didnt drop much during market plunge, keep them, they are the good ones.


Monday, November 8, 2010

StraitsAsia, Hyflux, First Reit, Sembmar ,Osim

Can consider to buy the stocks on the left if it break prior day high. If you are holding any of it, can consider to add position

Hyflux gap up above down trendline, changing trend. Good sign

First Reit: as what i posted, this stock gives good dividend and capital gain


StraitsAsia, gap up today follow by a big white candle. A breakout of this symmetrical triangle signify bullishness in this stocks. Consider to buy for mid-long term if it break prior day high.


Sembmar gap up today above the resistance, can consider to buy it tml break prior day high. Alot ppl may think this stock is expensive, think again, look at what happen to kepland which i previously posted.


Osim today up again, can consider to top up if it break prior day high. previous post on osim


Tuesday, October 5, 2010

Guocoland, Capitaland, Ezion, Longcheer, Noble Grp

Guocoland, If you have follow my previous post you could have entered it on last Tuesday, 1 week ago. Probably you are waiting to sell now, but wait, like what i always say, cut loss fast take profit slow, hang on to your urge in taking profit so fast. Today this stock has close above the resistance, breaking the symmetrical triangle chart pattern. Can add on your position tomorrow if it goes higher. Entry 2.45, Exit 2.35, Mid-long term. If you are adding position, add a 25% lesser quantity than your previous position/

Other stock with similar setup will be: Capitaland, Ezion, Long cheer, Noble grp

Thursday, September 23, 2010

Fragrance, Capitacomm

Fragrance, an interesting stock for today. Have anyone heard of the term call "professional gap"?If the stock gap up, and continues to move higher, it is most likely done by the professional, because normal people will not buy at such high price. Further more, if the stock gap up above the resistance e.g A and B. Another sign of bullishness is it actually close higher than the previous peak hence again most likely is the professional job. Lets learn from this stock, and see how it goes few more days..

Capitalcomm, uptrend stock, breakout from triangle pattern. Can consider to get in if tomorrow goes higher. Entry 1.49, Exit:1.33 timeframe: mid long term 2week to 3month

Wednesday, September 8, 2010

Hi-P 3-5days trade

Hi-P broke out of ascending triangle pattern, supported by 10,20ma. Can consider enter at 0.895, Stop Loss 0.875, Target 0.925 Timeframe 3-5days' trade. Overall market down, STI drop 25point, but this stock still up and holding, I am quite positive.

Tuesday, August 31, 2010

Starhub - defensive and high dividend, follow up

Starhub today broke ascending triangle formation, may signal for further uptrend.
Ascending triangle is a bullish formation that usually forms during an uptrend as a continuation pattern that indicate accumulation.

Candlestick: It also forming a Bullish engulfing pattern. Read more at investopedia http://www.investopedia.com/terms/b/bullishengulfingpattern.asp

Tuesday, August 17, 2010

Descending triangle pattern on Oceanus

Oceanus, a descending triangle chart pattern has formed on this downtrending stock since early this year. Stock is define as downtrend if the stock price is below the 200, 50,20 moving average line. This stock has shown some bearish signal this few days that gave us an opportunity to sell short. If next few day it breaks below $0.30 it will be confirmation of a downtrend breakout.


Sunday, July 11, 2010

Yangzijiang continue to move higher!


Symmetrical triangles for the most part, showing an aimless in direction. The market seems listless in its direction. The supply and demand therefore seem to be one and the same. The upper line(downward sloping) symbolize the resistance and the lower line (upward sloping) is the support. A parallel line drawn above the support is the shorter term resistance. In this case a break above the resistance means there is more upside to be seen.


On Friday Yangzijiang continue to move higher after breaking out of the symmetrical triangle, ended at the highest point of $1.44 forming the second Big white candle. This generally consider bullish, as price closed significantly higher than they opened. If the candle appears during breakout above a resistance area the long white candle adds credibility to the breakout.

Bought some using CSI system at $1.34 three weeks ago, when it gave the orange to blue bar signal. The major trend of this stock is sloping upwards, hence we believe that there will be higher success rate of this stock going higher. Added position at $1.39, will be selling half for short term profit, targeting 1.49. Keep the rest till CSI give sell signal.